Sales
Live demo
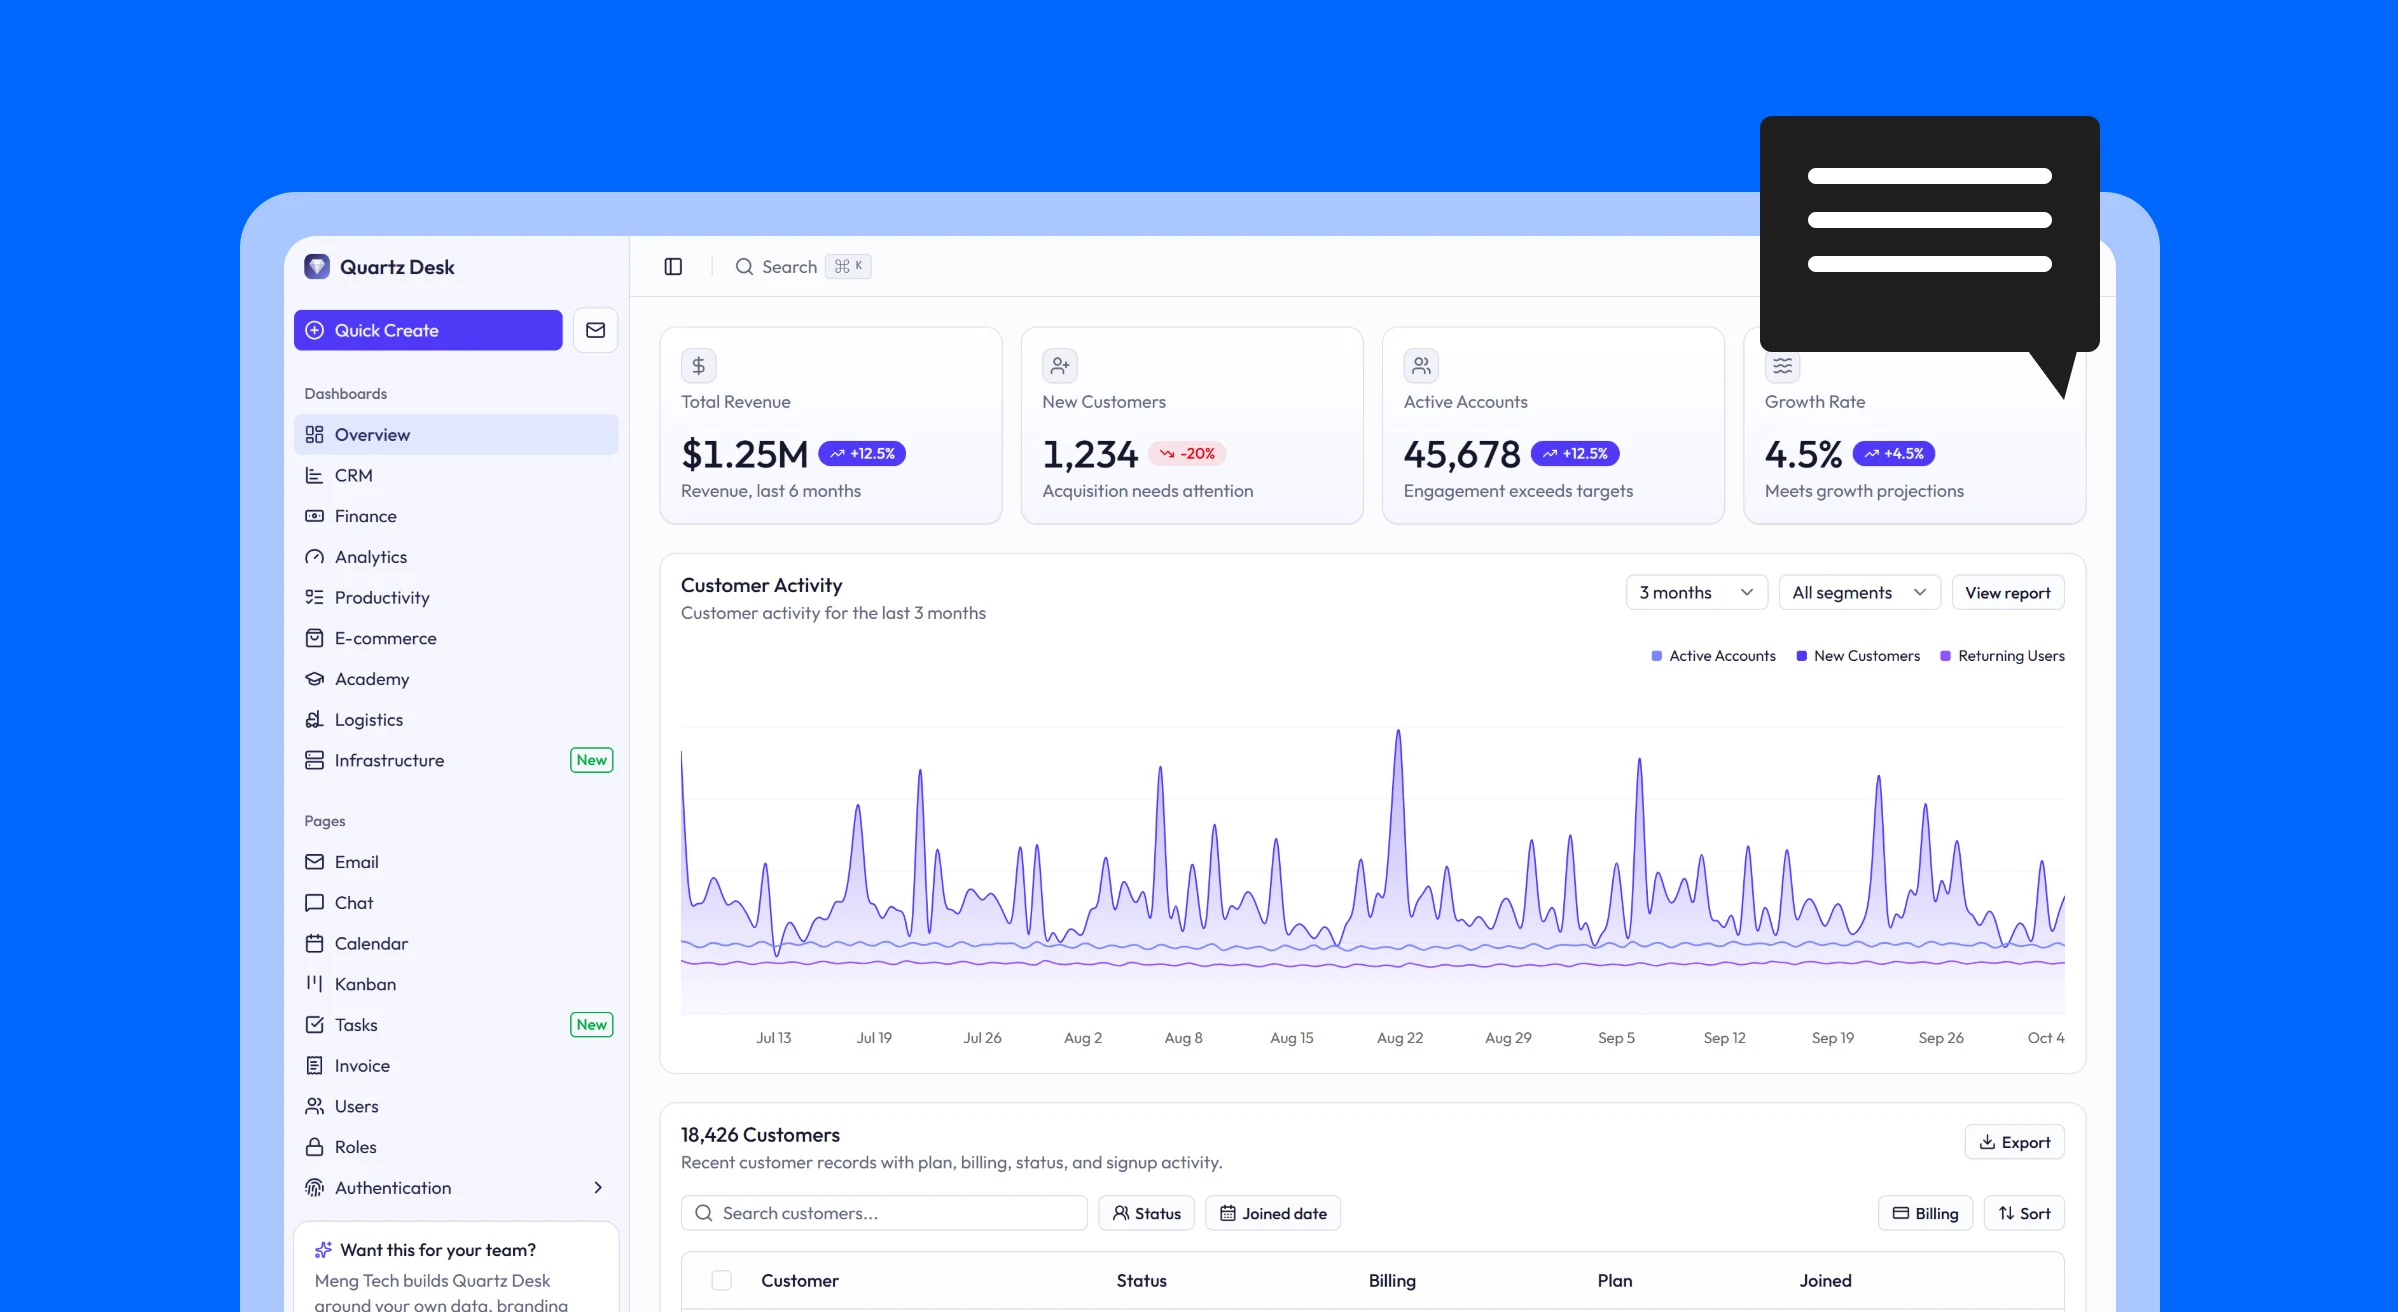
Revenue and growth KPIs, customer activity over time and a searchable customer table.
Open Dashboard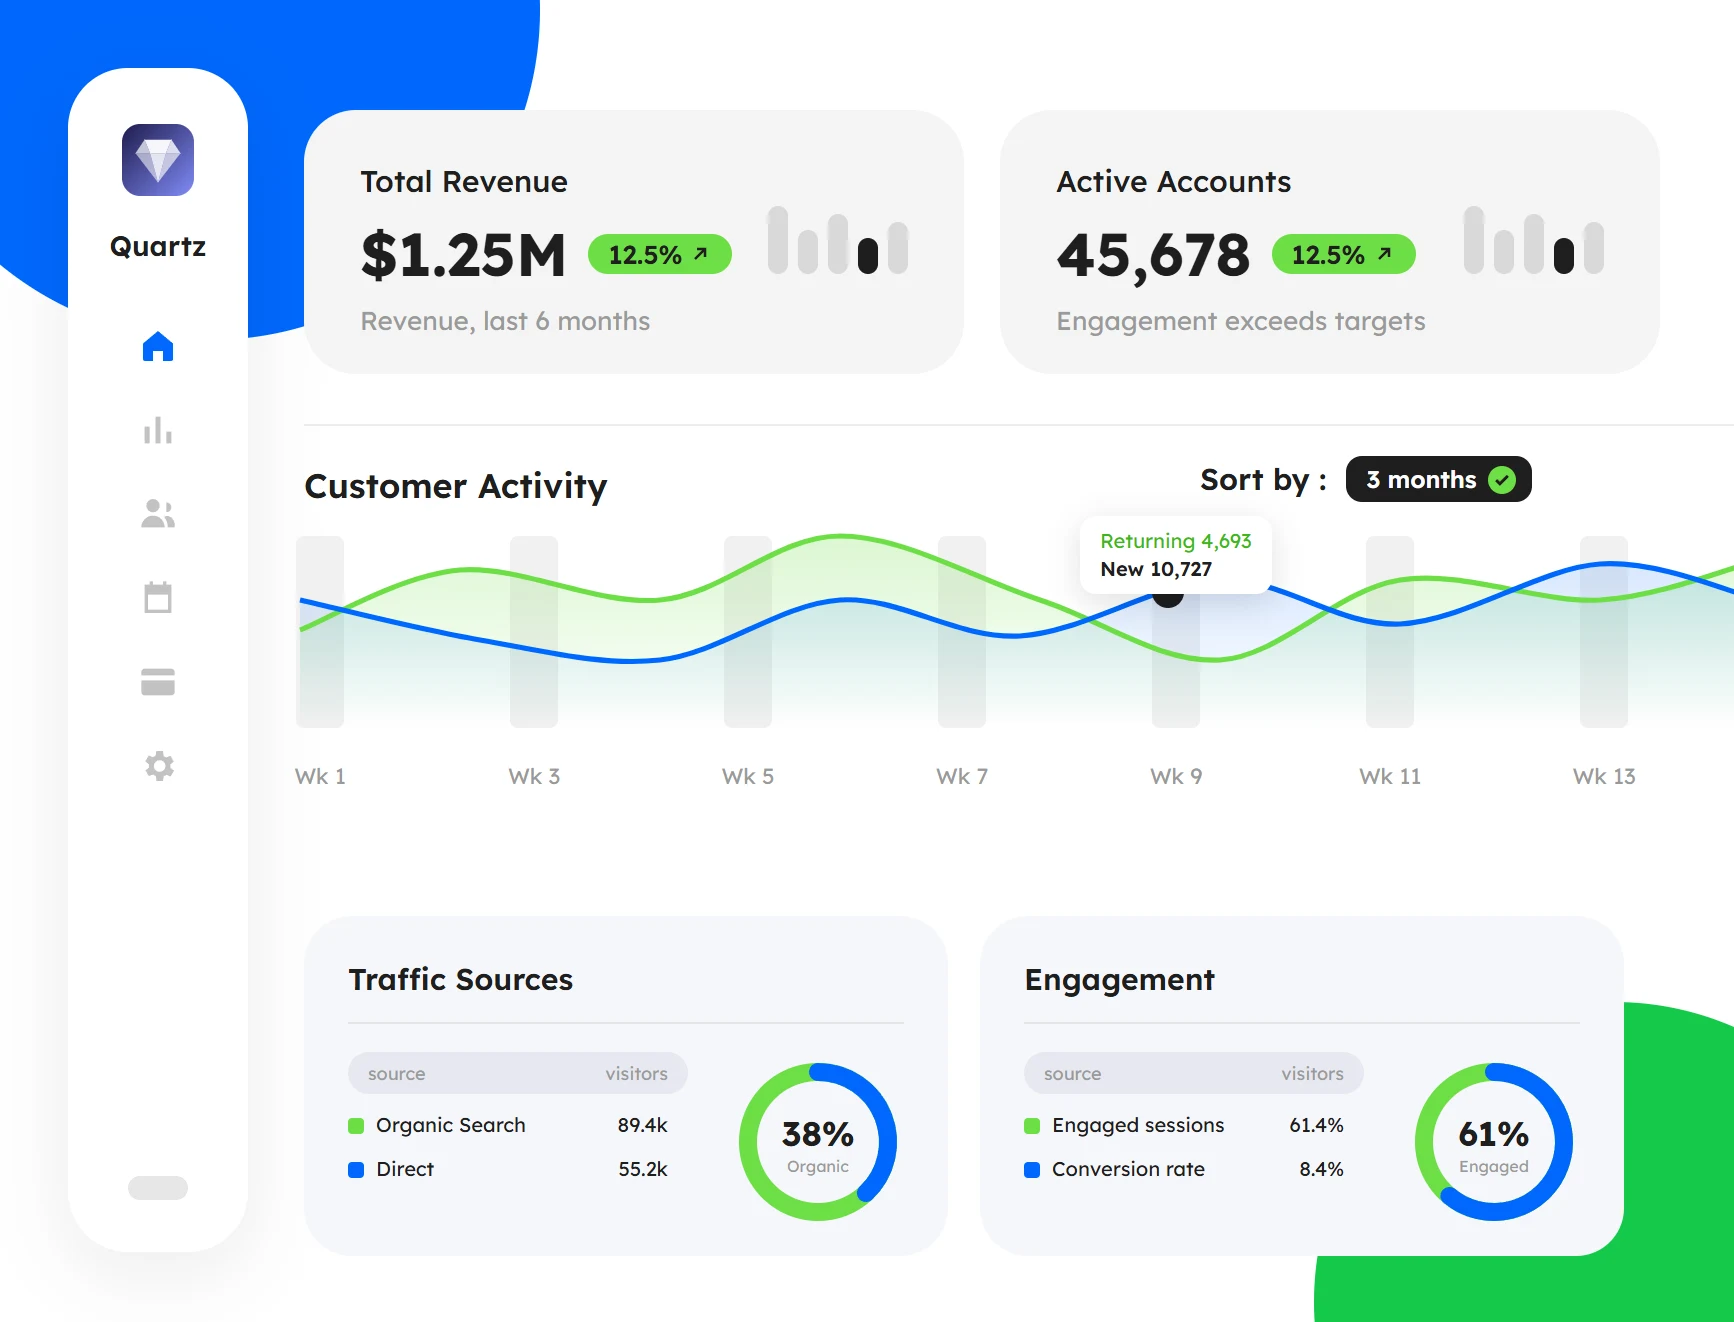
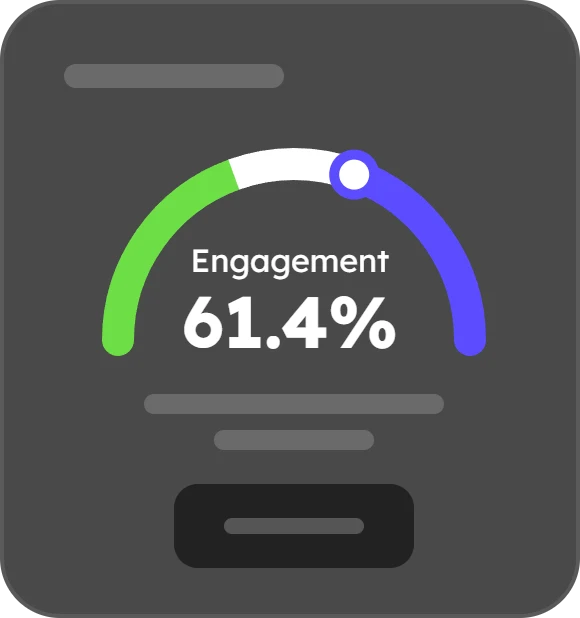











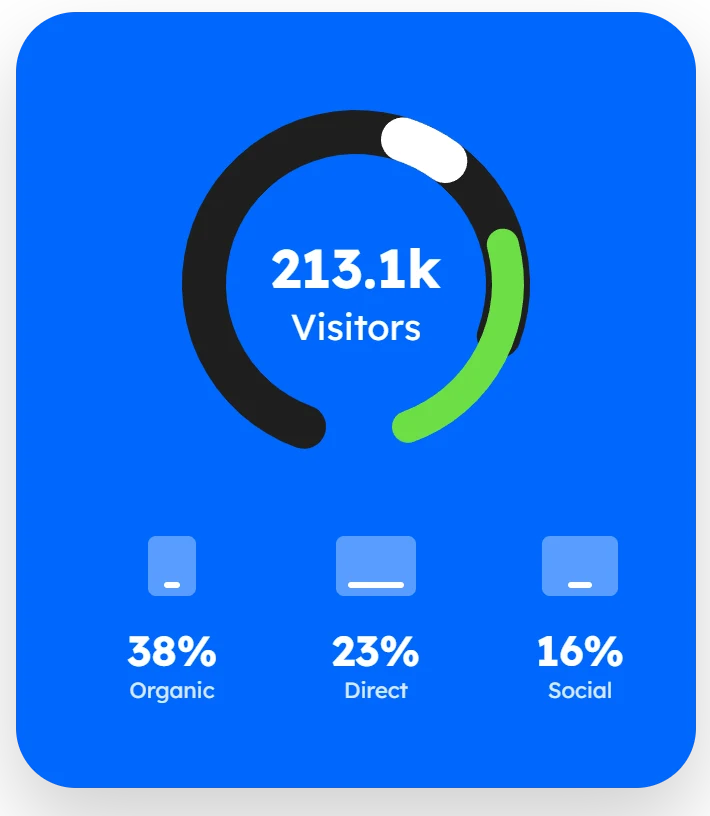

Revenue, customers, pipeline, cash flow, traffic and shipments. Each dashboard opens on realistic sample data, so you can judge the real thing.

Press Ctrl+K to jump to any page or switch the theme.
Download the filtered users or CRM table as a CSV.
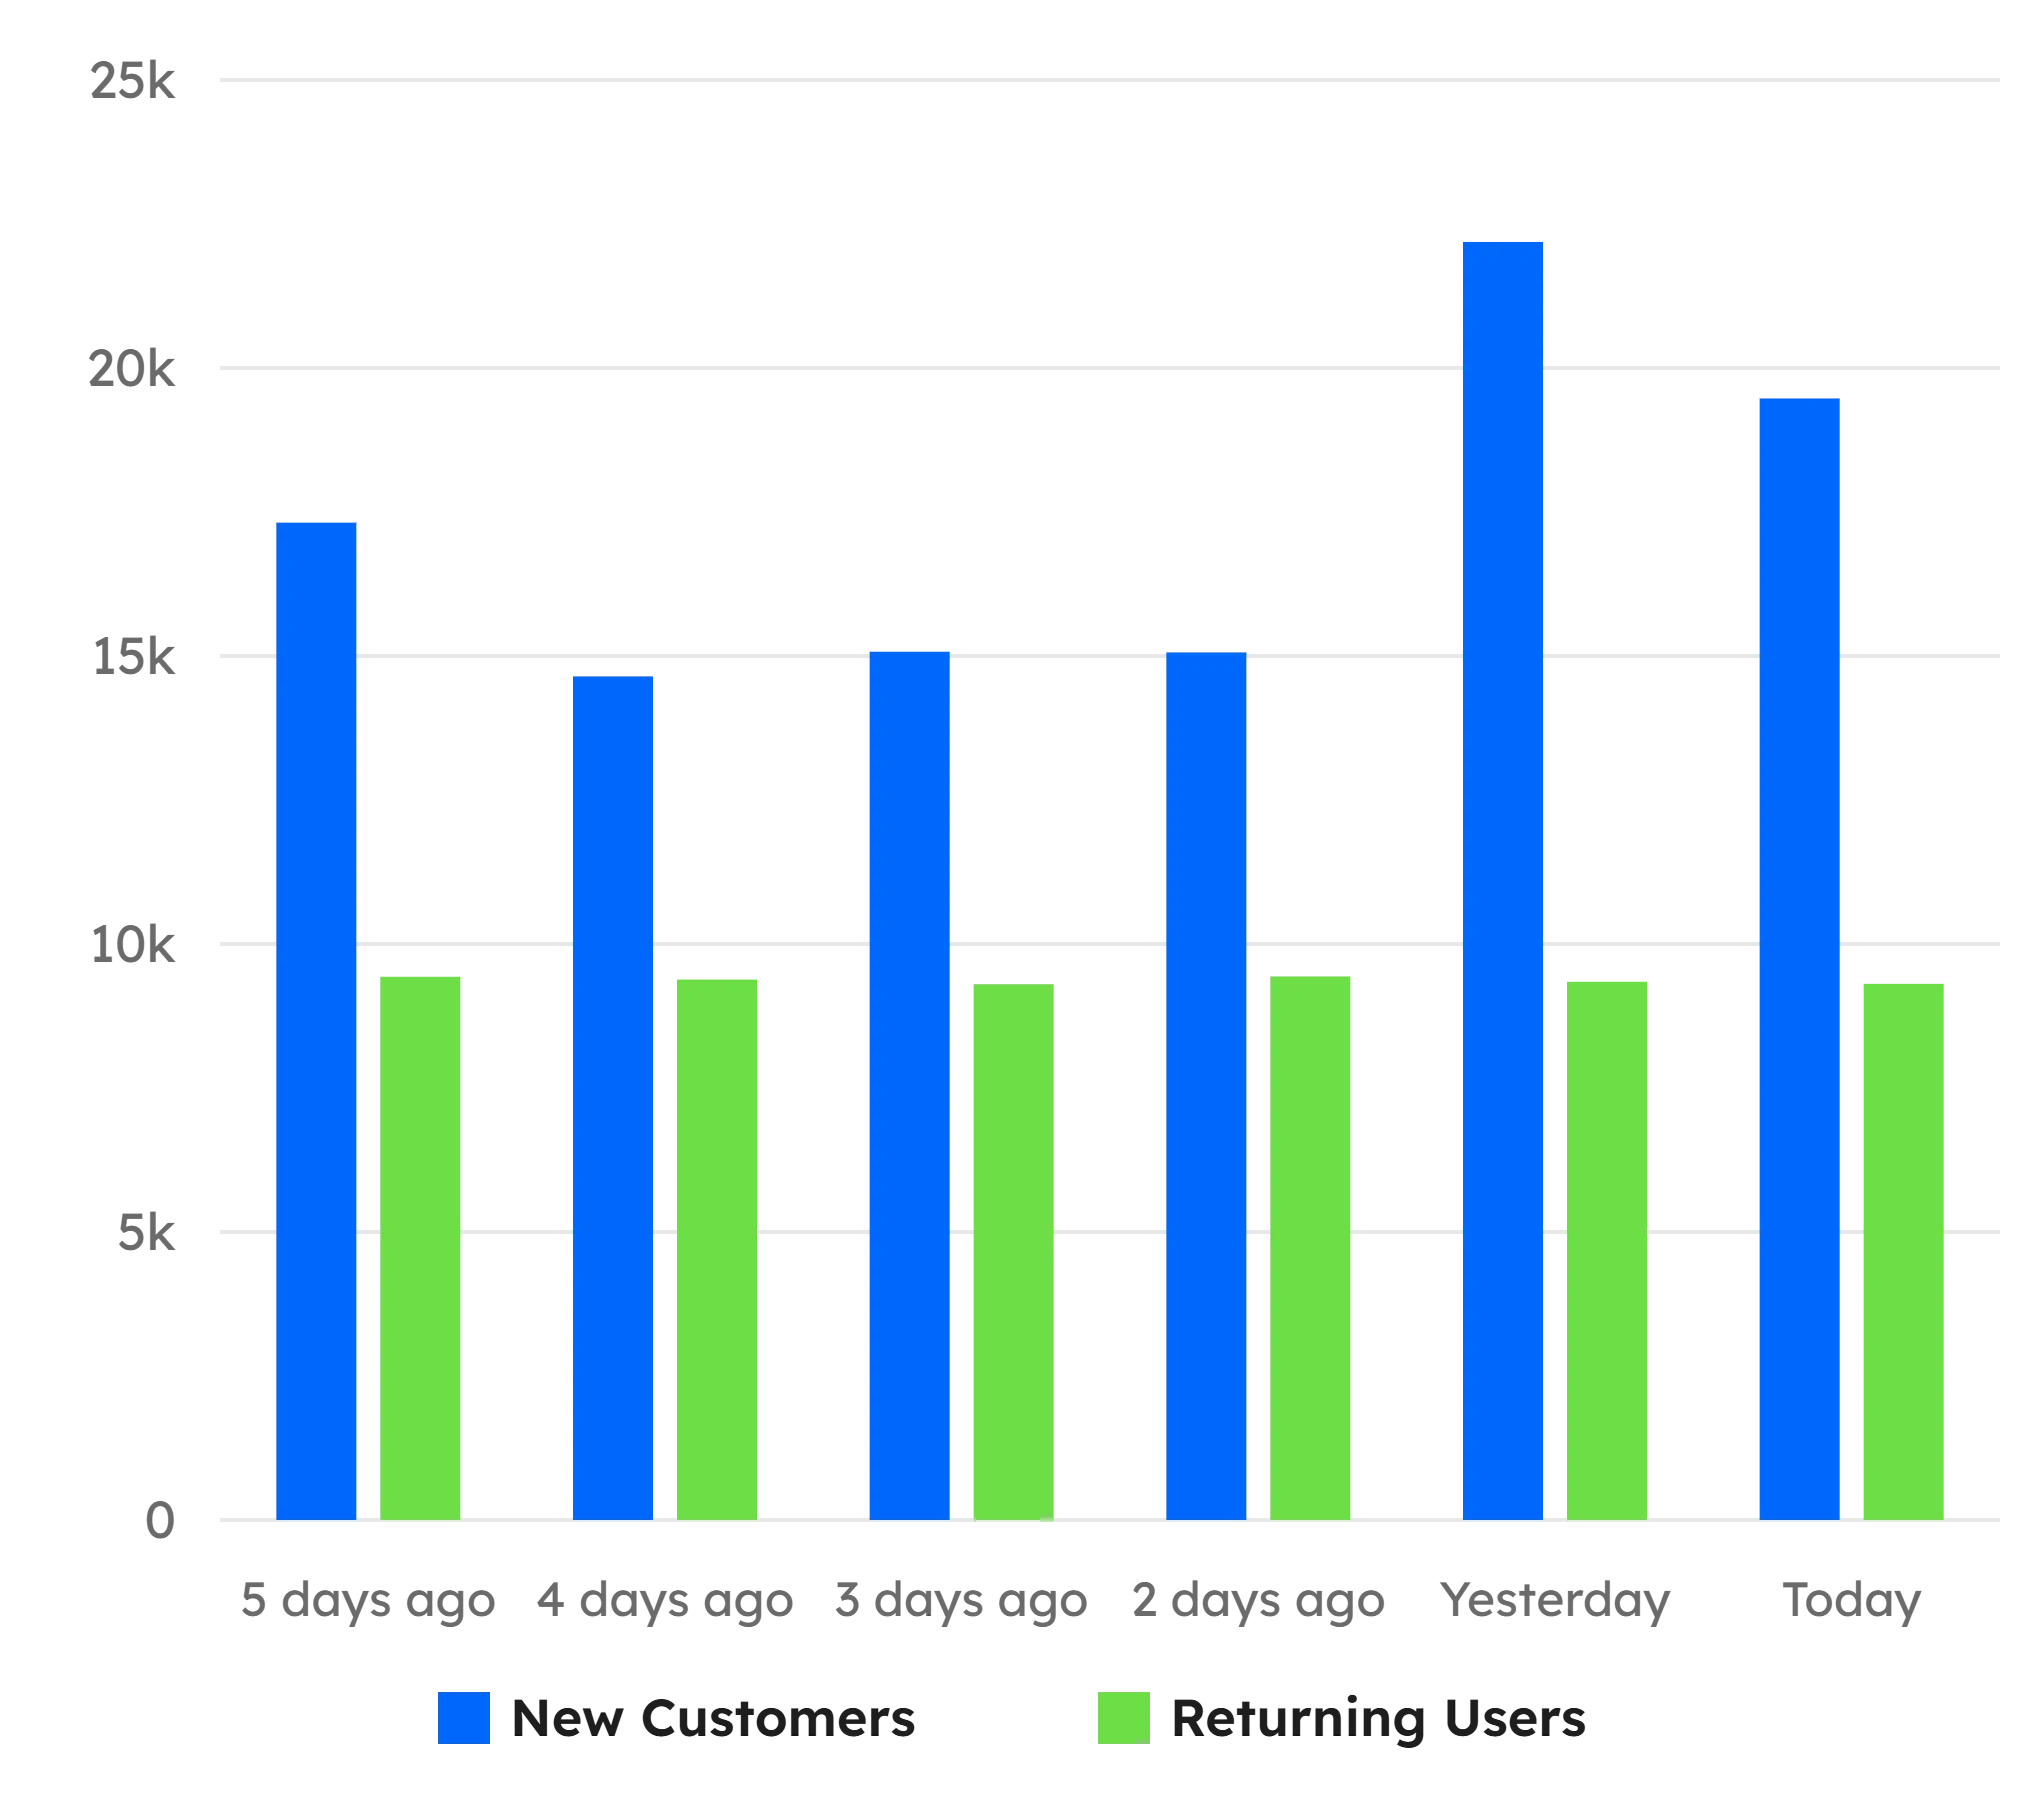
The Overview dashboard tracks new customers, returning users and active accounts side by side, with a searchable customer table underneath.

Revenue, growth and account health at a glance
A searchable customer table you can export as CSV
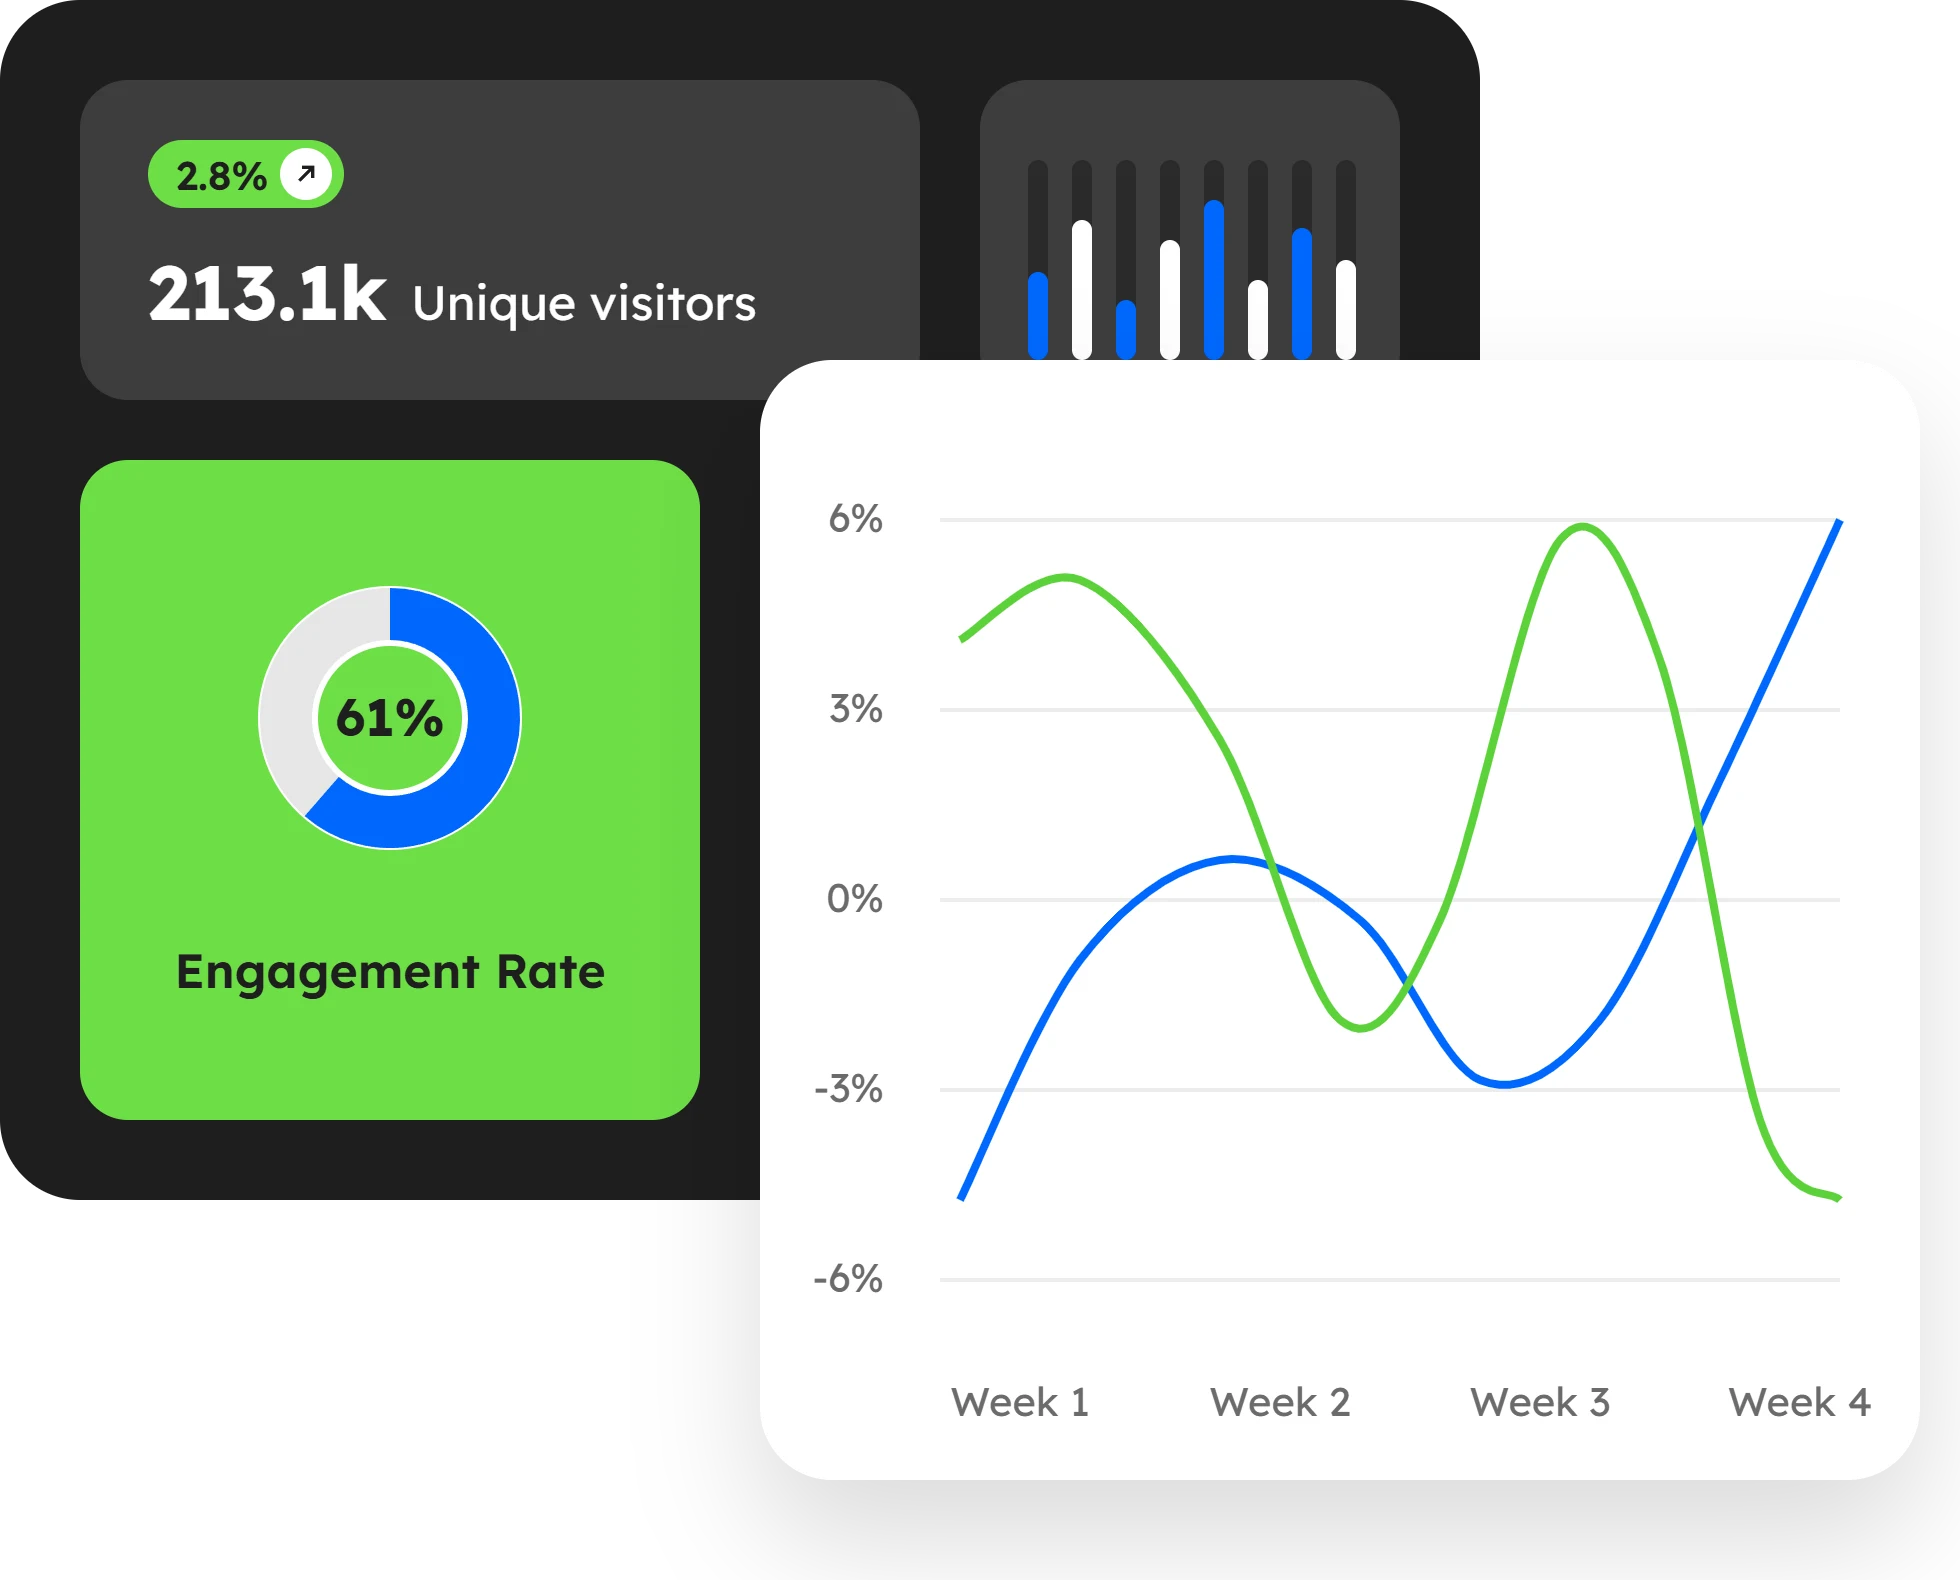
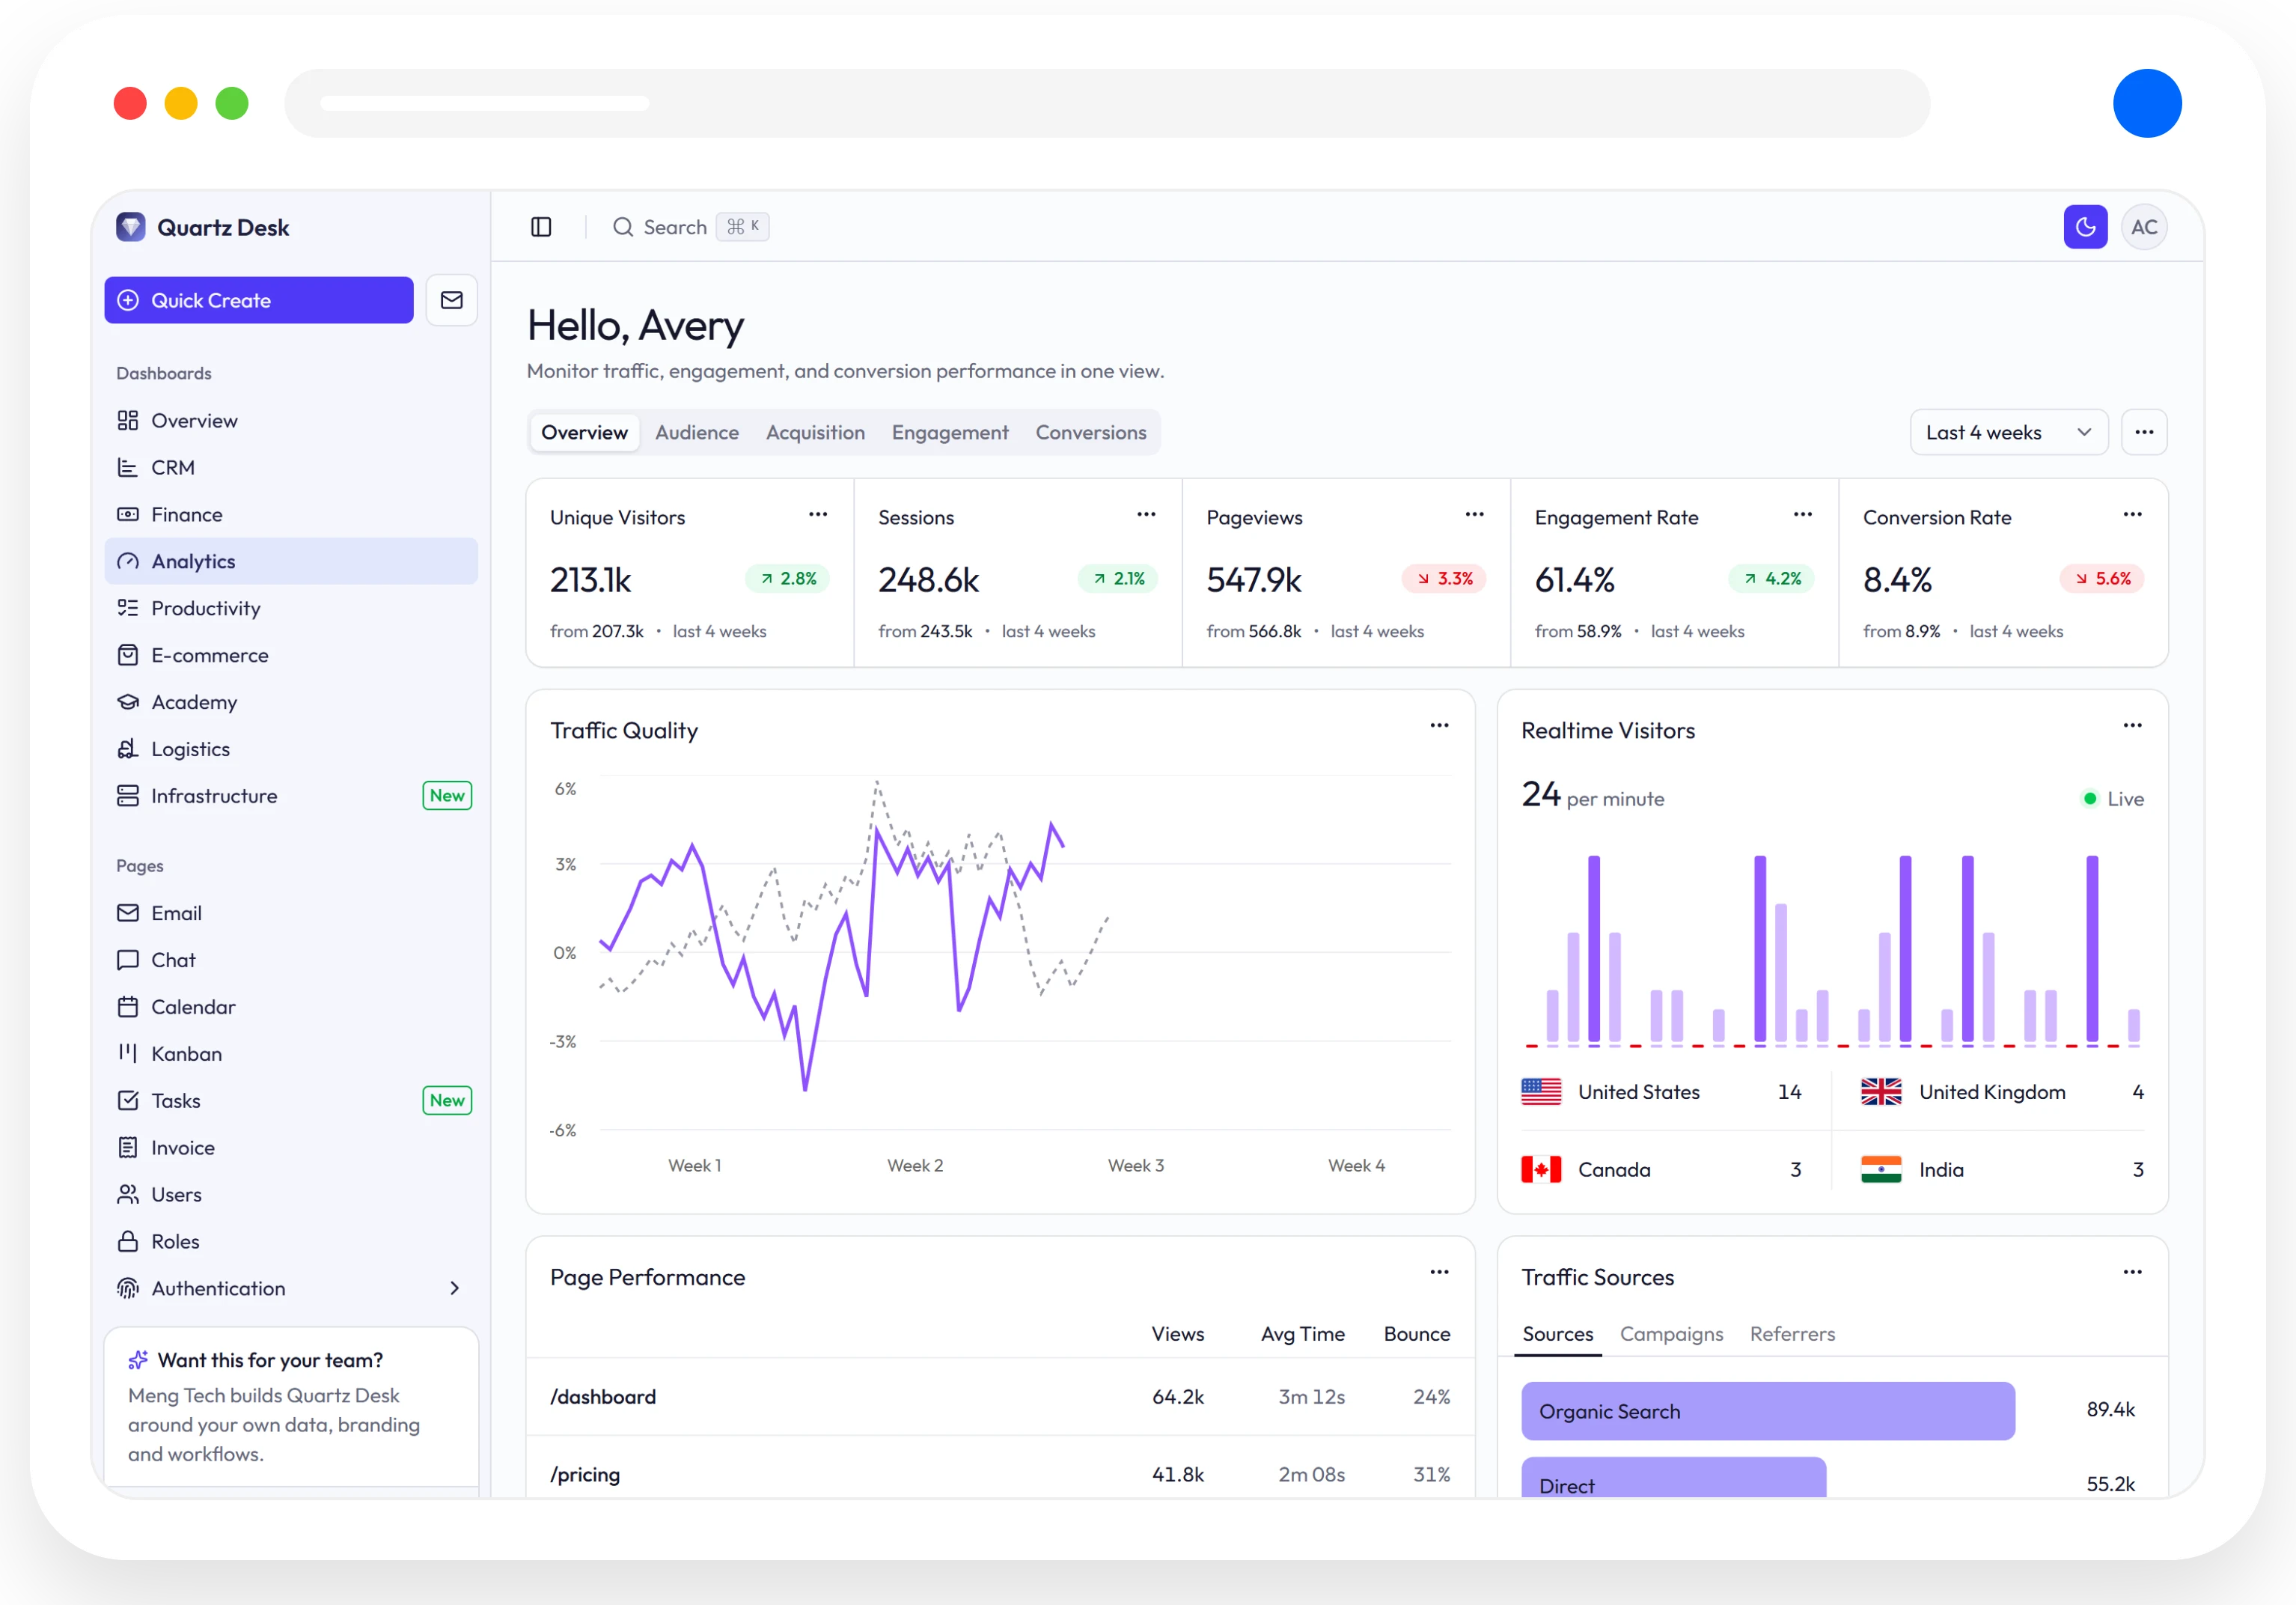
Unique visitors, sessions, engagement and conversion, with realtime traffic and page performance in one view.
Not a static mock-up: every feature below works in the live demo right now, on sample data, in your browser.
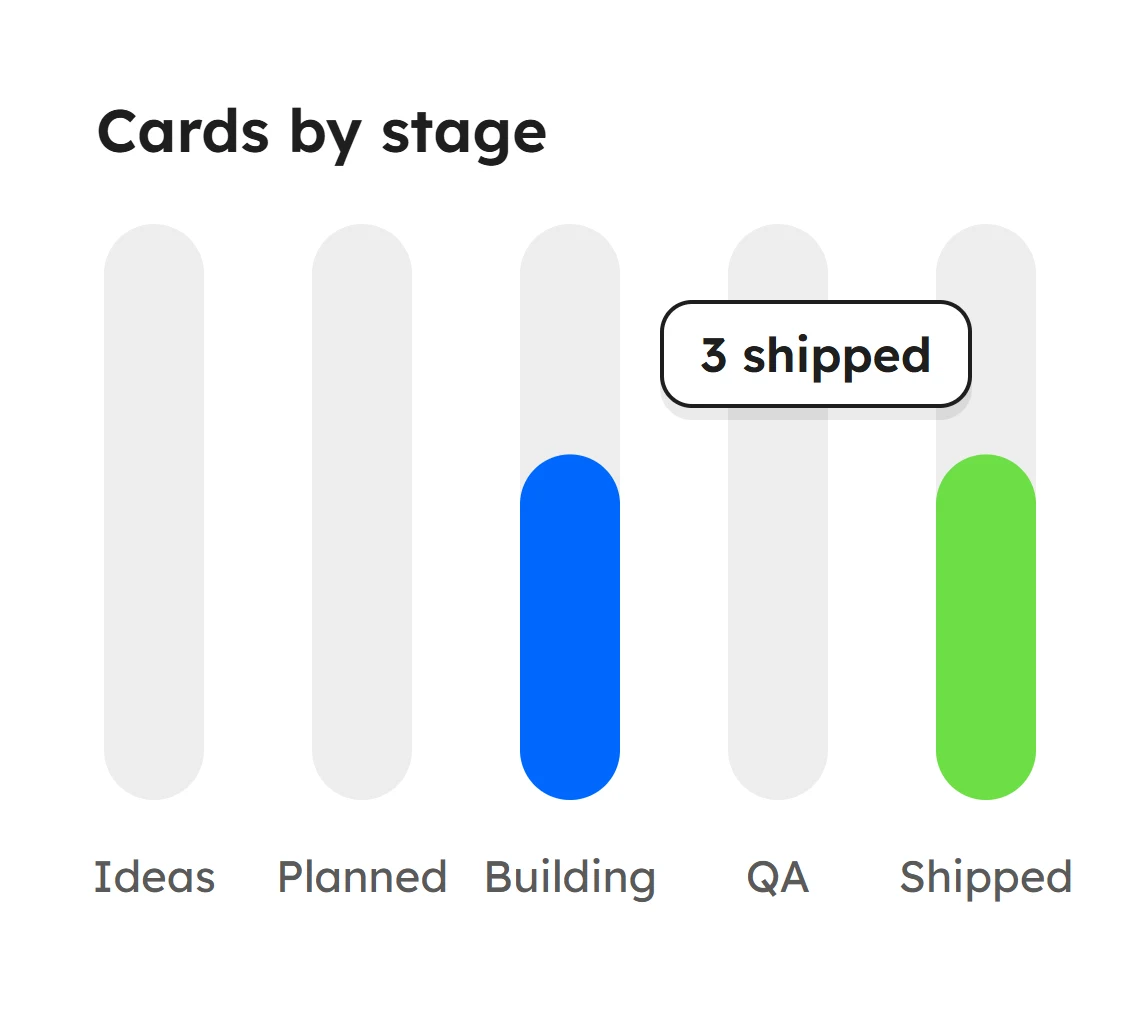
Create, edit, drag and delete cards across five stages. Your changes stay in this browser between visits.
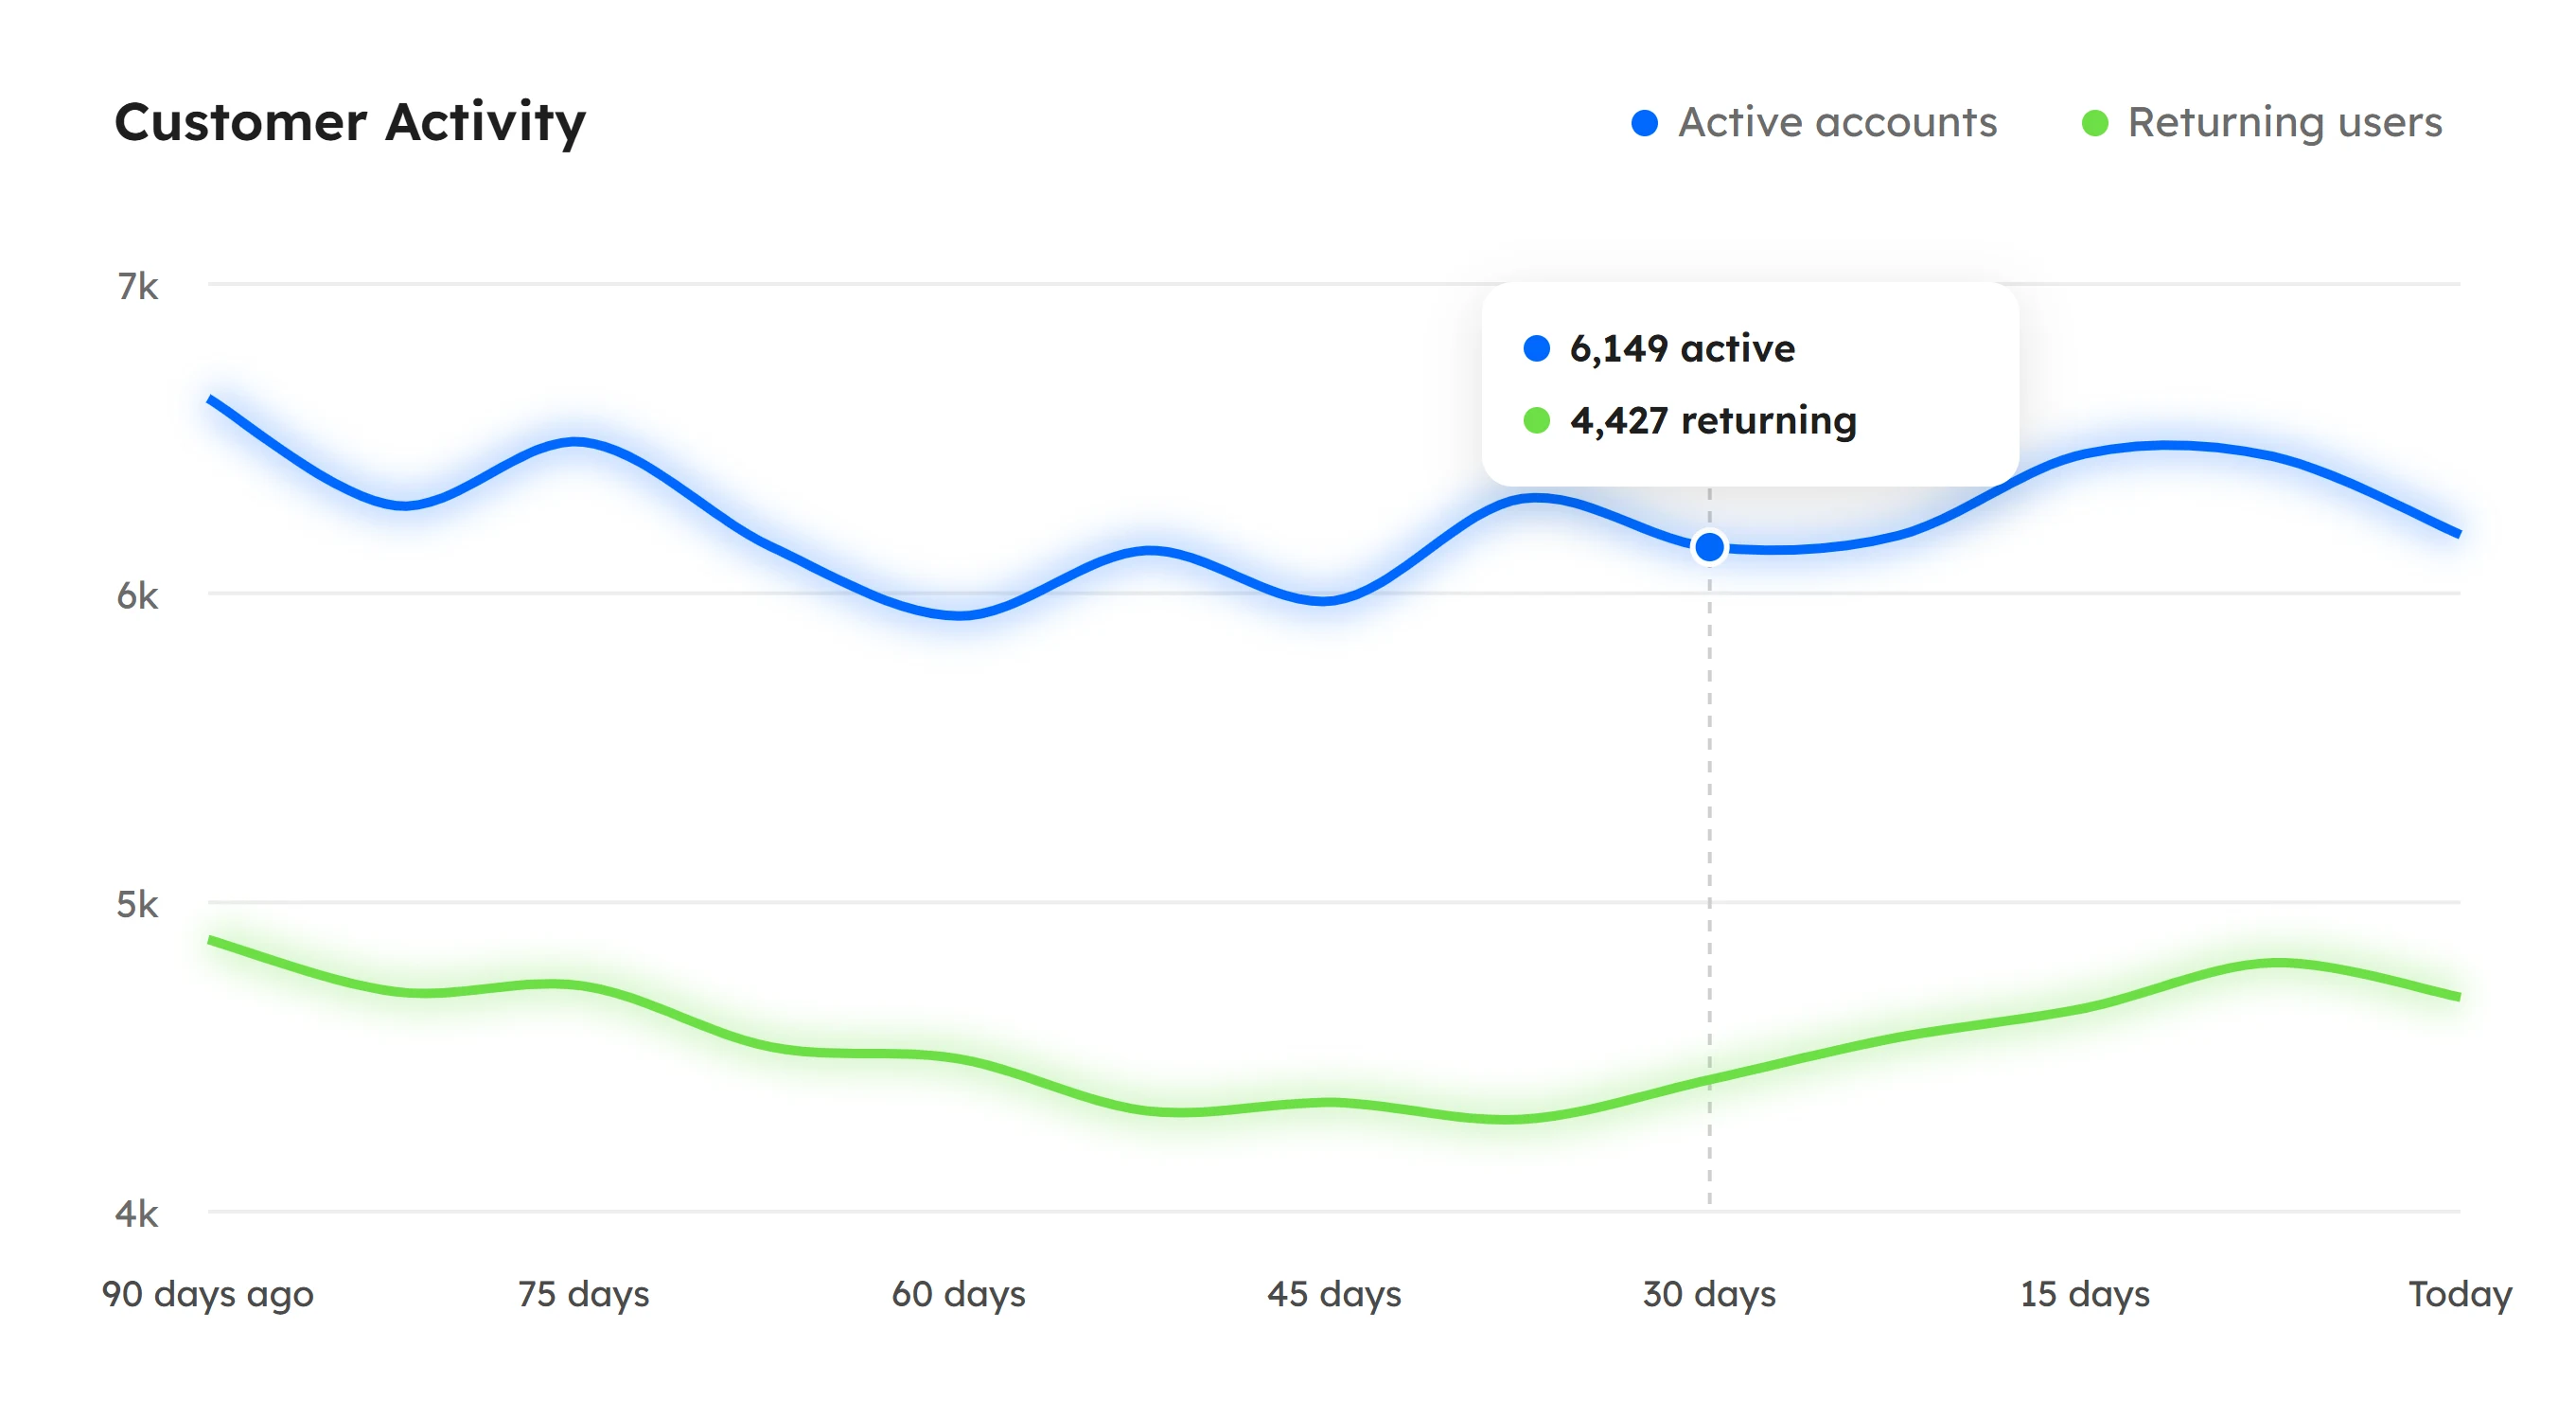
Hover any chart for exact values. Every dashboard draws its charts from realistic, ready-made sample data.
Overview, CRM, finance, analytics, productivity, e-commerce, academy, logistics and infrastructure, one sidebar.
Filters, sorting and column choices on the Users table are remembered, with a one-click reset.
Narrow the users or CRM table down to what matters, then export exactly that view as a CSV file.
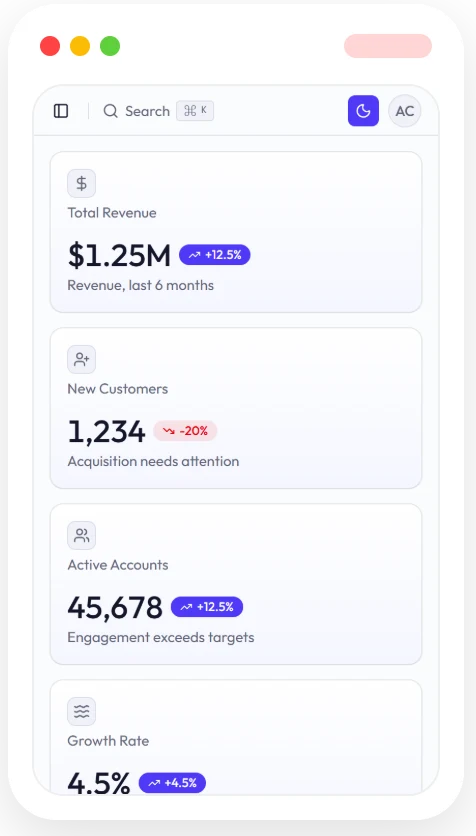
Open the demo on your laptop, tablet or phone. Every dashboard keeps its numbers readable and its controls within reach.

Switch modes from the header, or theme presets from the command palette.

The sidebar, tables and charts adapt from wide desktops down to phones.
Quartz Desk runs on a modern, widely supported stack, so the full version is easy for any team to own, host and extend.










Shipment alerts and role-based access are in Building. Drag a card to Shipped when it's done: the board remembers.

No account, no card and no sales call before you have seen it working. Try it first, then tell us what your team needs.

Start on the Overview dashboard. No sign-up, no card and nothing to install.

Move cards, filter tables and switch themes. The sample data is yours to play with.
Message us on WhatsApp or by email, and we build the full version around your data.
Live demo
Revenue and growth KPIs, customer activity over time and a searchable customer table.
Open DashboardLive demo
Live demo
Live demo
Yes. Open it and click around: there is no sign-up, and nothing you do leaves your browser. Kanban changes are saved in this browser only.
No. Every figure is realistic sample data for a fictional company, Verdant & Co, so you can explore without risk.
Overview, CRM, finance, analytics, productivity, e-commerce, academy, logistics and infrastructure, plus mail, chat, calendar, Kanban, tasks, invoice, users and roles pages.
Yes. Randy See builds the full version around your database, CRM, store or APIs, with your branding and your domain.
Real sign-in, roles and permissions, only the dashboards your team uses, deployment, and the source code handed over to you.
Message Randy See on WhatsApp or by email with what you need. We reply with questions and a proposal, not a sales script.